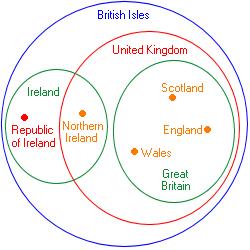
Since we’re posting Venn diagrams… this one came to mind. I’m aware that it may spark controversy, but how else can you represent it so clearly?
From the author: “The Republic of Ireland and the United Kingdom are the only two sovereign states in this image. They are shown in red. Ireland and Great Britain are both islands and are shown in green. England, Scotland, Wales and Northern Ireland are constituent countries of the United Kingdom and are shown in orange.”
Oh… and technically it’s really an Euler diagram because it shows relationships other than pure intersections.
Posted in math, random, silly|Comments Off on The British Isle Venn
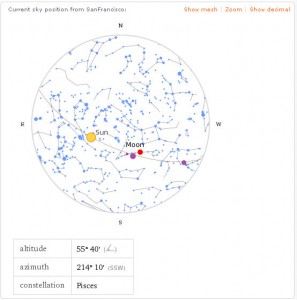
My dad just sent me a demo for jaw-dropping “computational knowledge engine,” Wolfram Alpha, which went live this past weekend. You put in a search term, which could be a mathematical formula, two cities, whatever, and it analyzes the term and its context and returns related statistics, plots a curve, gives you a map, shows mortalitiy rates, whatever! Off the hook!
The design reminds me of a suggested contextual search engine design from Tufte I remember reading somewhere…anybody remember?
My friend Jay Schuster just pointed me to a really fun graphical description language, which can produce beautiful images with remarkably small amounts of code.
I encourage you to check out the galleries at contextfreeart.org and try it yourself if you’re inclined.
To give you a taste of what it’s like, this snippet of code:
I’ve been wanting to share this blog with you all for a while. I’ve been reading it for the past four months or so and have found it to be continually interesting. It’s a blog run by Victor Niederhoffer, a semi-famous Wall Street trader who was written up in the New Yorker recently (which is how I found out about him). Wikipedia says this about him:
He’s lost all his money (and his clients’ money) two times, but has recovered both times. People aren’t sure what to think about him. His blog primarily offers insights into how any natural phenomenom relates to the market, but you’ll find just about anything there.
One of his best friends is this guy named Bo Keely who has had a life so incredible that he almost seems mythical to me. Although of the pedigree, he lives his life as the antithesis of a Wall Street trader (literally in a hole in the desert). Check out one of his posts on his life and his blog:
Claude E. Shannon, founder of modern information theory, stated that it was in his 1948 paper named A Mathematical Theory of Communication. He stated that the amount of information entropy in a signal is equal to -∑p(x)log[p(x)] over the set X where p(x) is the probability that the message x out of X possible messages was received.Some just think it’s noise because they don’t want to listen.