[S]ince 1993 [Omar] Suleiman has headed the feared Egyptian general intelligence service. In that capacity, he was the C.I.A.’s point man in Egypt for renditions—the covert program in which the C.I.A. snatched terror suspects from around the world and returned them to Egypt and elsewhere for interrogation, often under brutal circumstances.
Austin Seraphin (who is nearly blind) describes the revelation of using an iPhone with Voice Over functionality:
I spent ten minutes looking at my pumpkin plants, with their leaves of green and lemon-ginger. I then roamed my yard, and saw a blue flower. I then found the brown shed, and returned to the gray house. My mind felt blown. I watched the sun set, listening to the colors change as the sky darkened.
It’s inspiring that the Apple engineers and developers are working hard to make their devices and software accessible to the widest possible number of people.
Posted in computers, design, society, tech|Comments Off on “I Watched the Sun Set, Listening to the Colors Change…”
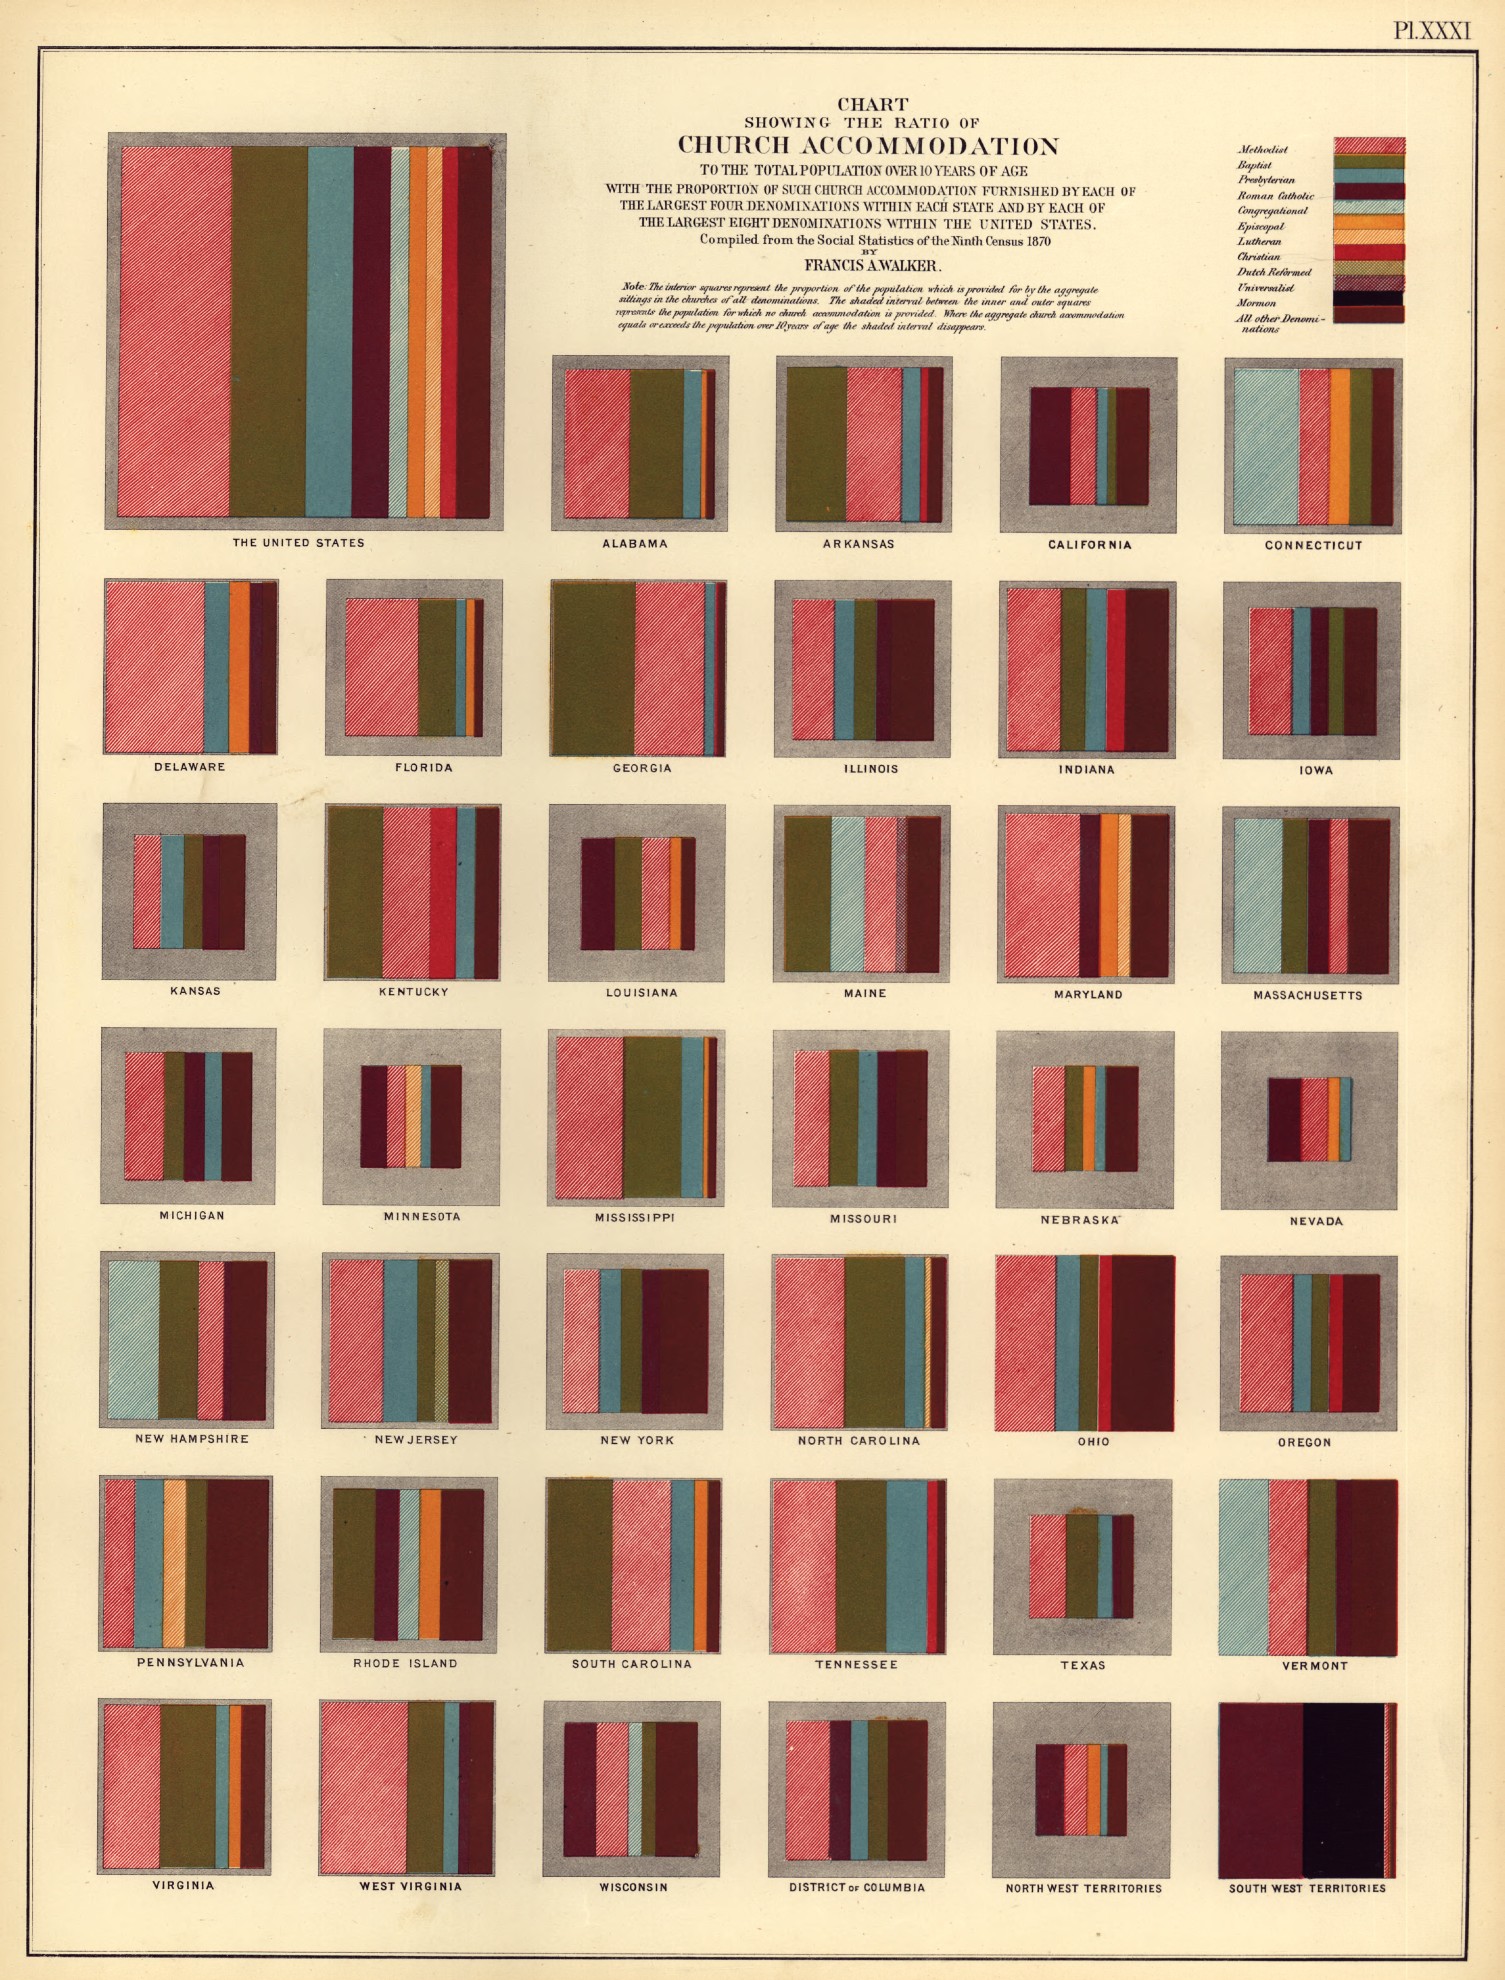
You wouldn’t expect to find such beauty in the Statistical Atlas of the United States, Based on the Ninth Census (1870) from the Library of Congress, would you? Sophisticated data visualizations, hand-calculated and hand-engraved, in beautiful colors, prepared by a staff headed by Francis A. Walker, M. A., superintedent of the ninth census.
The display above shows you, for each U. S. state and territory, the proportion of the church-going population (the colored boxes) relative to the total population (the shaded box in which the colored boxes are set), as well as the breakdown by the top 11 denominations!
An amazing/creepy visualization of what life might be like when we are “jacked in” to a virtual overlay 24/7. Lots of great little details in the animation. Note the sea of advertising that can be controlled, paying you more money per second depending on your environmental saturation.
The latter half of the 20th century saw the built environment merged with media space, and architecture taking on new roles related to branding, image and consumerism. Augmented reality may recontextualise the functions of consumerism and architecture, and change in the way in which we operate within it.
A film produced for my final year Masters in Architecture, part of a larger project about the social and architectural consequences of new media and augmented reality.
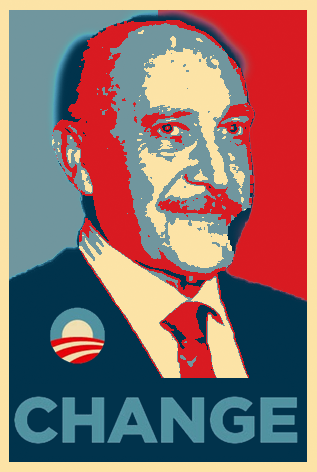
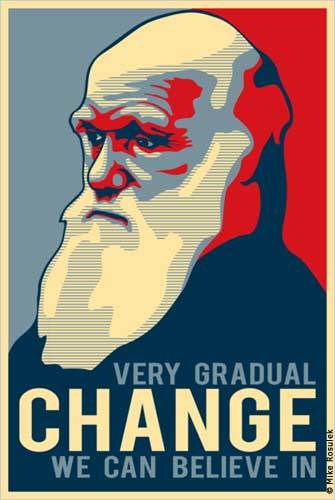
Okay, so maybe referring to The Obama as specious is a bit of a stretch, but, dammit, I wanted that pun! And, really, it was just a setup for this awesome graphic by artist Mike Rosulek: